Live analytics dashboards
A dashboard that gathers your metrics in one place, readable at a glance on mobile and desktop.
AnalyticsResponsiveReal-time
We design and engineer dashboards, reporting and admin panels for Saudi businesses, with real-time KPIs, interactive charts and role-based access. Arabic and right-to-left, connected to your real data sources.
A complete dashboard that reads your data and turns it into a decision, not static charts.
A dashboard that gathers your metrics in one place, readable at a glance on mobile and desktop.
Clear KPIs that update live from your data sources so you know where your business stands right now.
Scheduled reports ready to export to Excel and PDF to share with your team and leadership.
Interactive charts and data visualization that surface trends and detail in a single click.
Each role sees only what's theirs, with fine-grained permissions that protect your sensitive data.
We connect the dashboard to your databases, systems and APIs so your real data shows up in one place.
Projects we designed and engineered for our clients, from idea to launch.
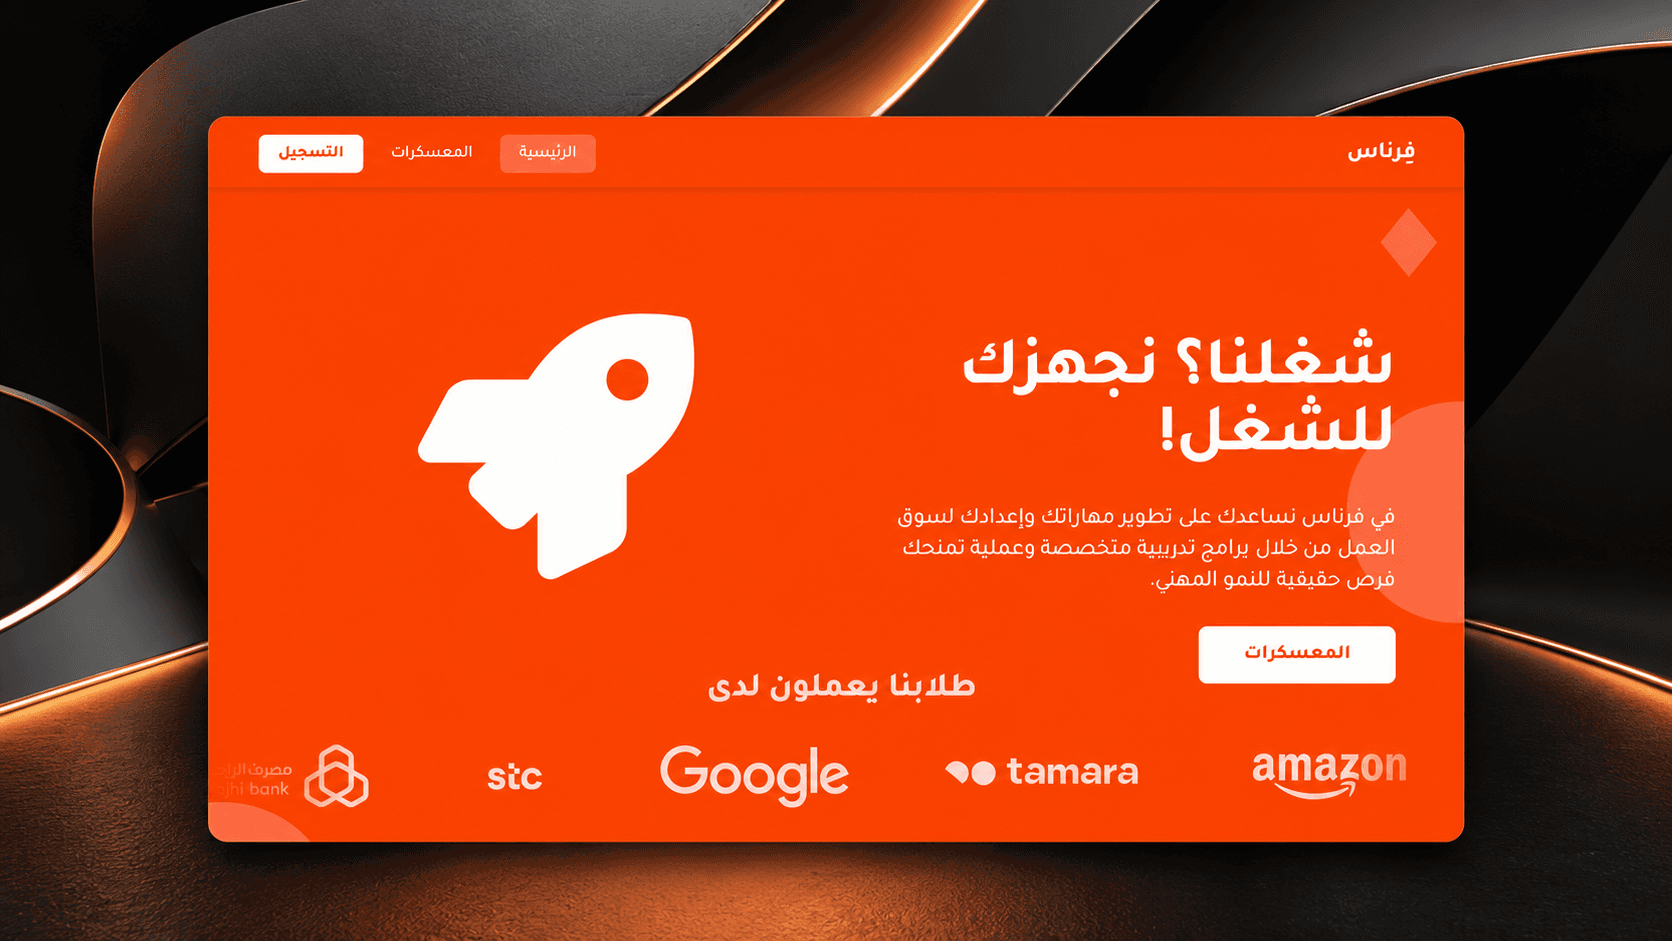
We get you ready for work: graduates hired at Google, STC, Tamara and Amazon.
A career-readiness platform that helps trainees build the skills and competence the job market wants, through practical tracks and challenges with outcomes recognized at leading companies.
View project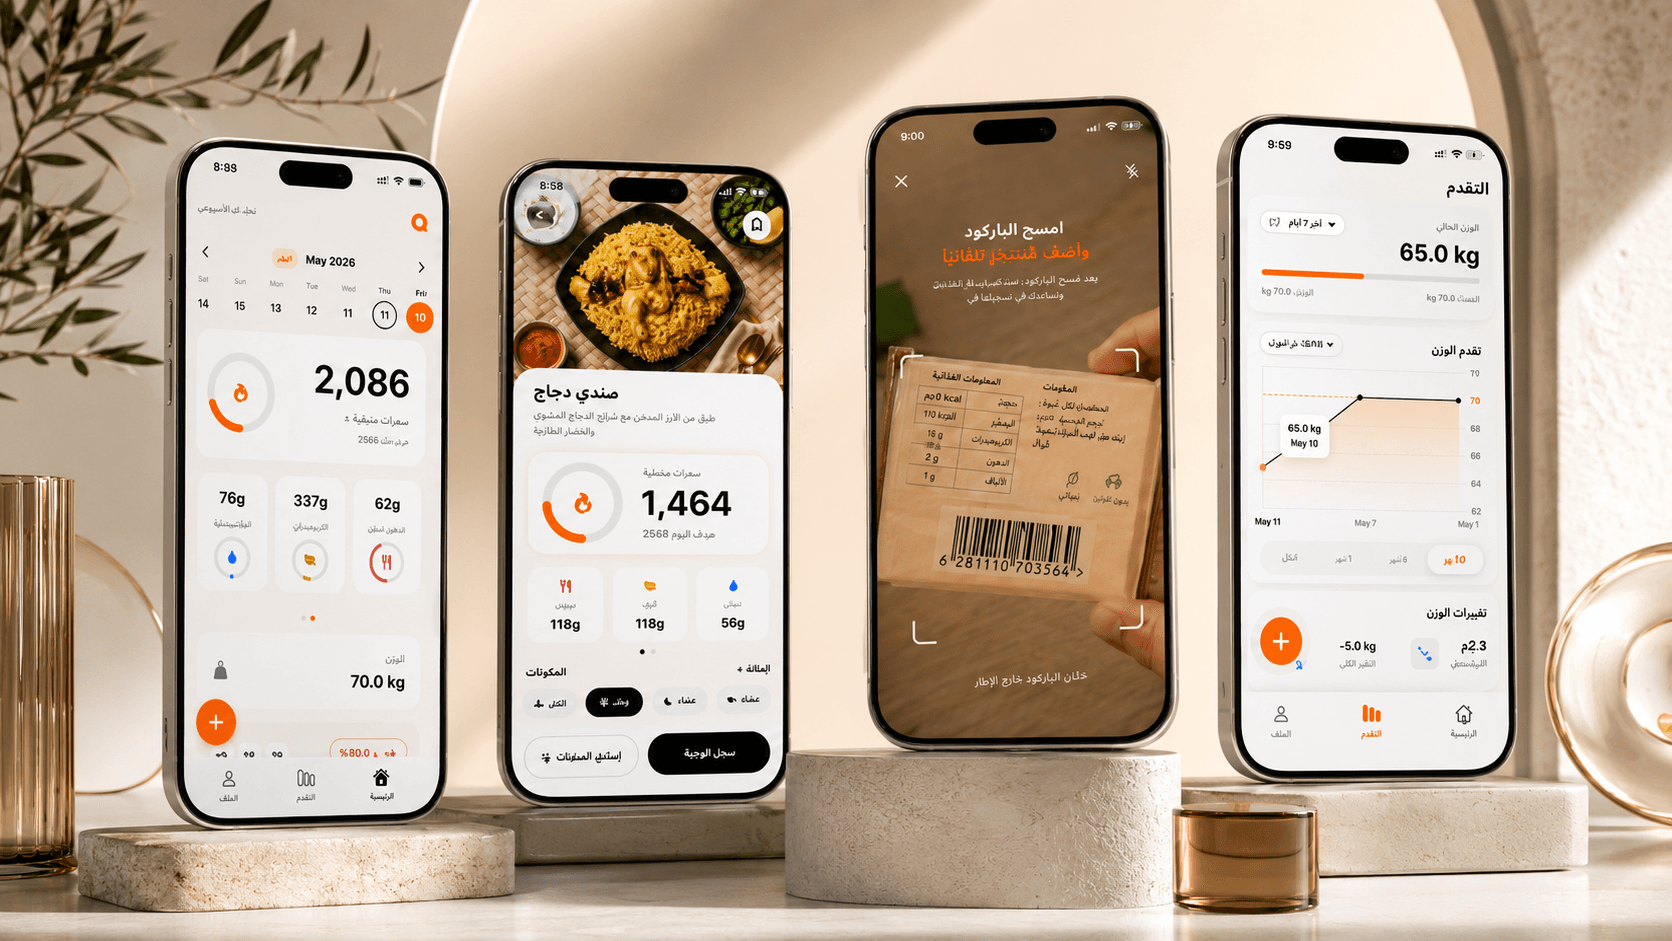
Instant AI nutrition tracking: snap your food, know its value. 10k+ users.
A fully Arabic nutrition app: photograph your meal or scan a barcode and it computes calories and nutrition facts while tracking your weight and progress.
View project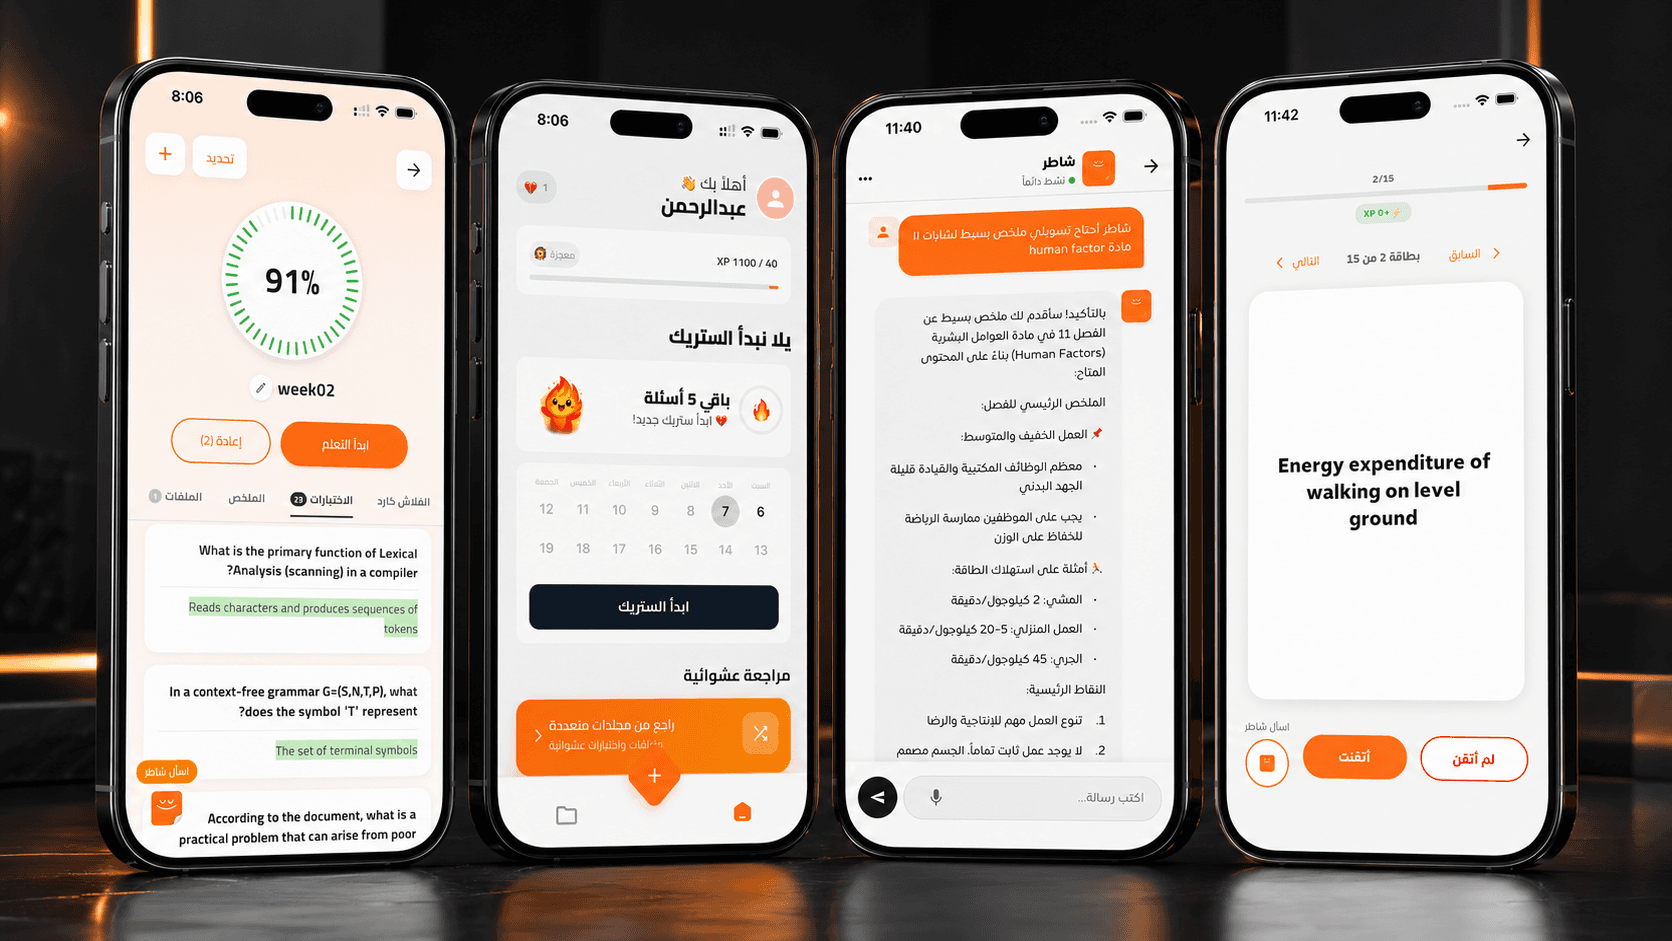
Study from your own files: AI-generated quizzes and flashcards.
An Arabic study app: upload your files and lectures and AI turns them into quizzes, flashcards and a study schedule with XP to keep you going.
View projectA clear path with a steady rhythm that gets you a working dashboard in weeks.
We define the metrics that matter, who reads them and the decision they support.
We design the dashboard and charts in Arabic and English, which you see before the build.
We engineer the dashboard and connect your data sources, with roles, reports and exports.
We launch the dashboard to your team with confidence, after reviewing and testing data accuracy.
We stay on to add metrics and reports and grow the dashboard as your business grows.
A beautiful dashboard with wrong numbers is useless, so we review the data logic and sources before drawing a single metric.
We launch our products and watch their metrics ourselves, like Qooti and Shater, so we know how to build a dashboard a team actually relies on.
Arabic and RTL are the starting point, with careful handling of numbers, dates and direction in tables and charts.
Design, engineering, integration and support from one team that owns the outcome, with no scatter across vendors.
Yes. We design the dashboard to read your real data, connecting it to your databases and existing systems through APIs or a direct database connection. In the discovery phase we map your data sources and how to reach them securely, so all your numbers show up in one up-to-date place.
Yes. We build metrics to update live or at short intervals depending on the nature of your data and your need. We pick the right approach per metric, since some numbers need to be live while others are fine on a periodic refresh, balancing speed against running cost.
Yes. We build role-based access, so each user sees only the metrics and reports relevant to their role. This protects your sensitive data and makes the dashboard practical for every team, from leadership to operations, each seeing what they need.
You start by requesting a quote, a free call where we understand the metrics that matter to you, your data sources and who will read the dashboard. Then we come back with a clear scope and a quote tailored to your dashboard. Get in touch to book the call.
Tell us the metrics that matter and your data sources, and we'll come back with a clear scope and a quote tailored to your dashboard.
Have a question or an idea? Send us a message and we'll get back to you as soon as we can.
We'll reply shortly
Or reach us directly at contact@muntajstudio.com